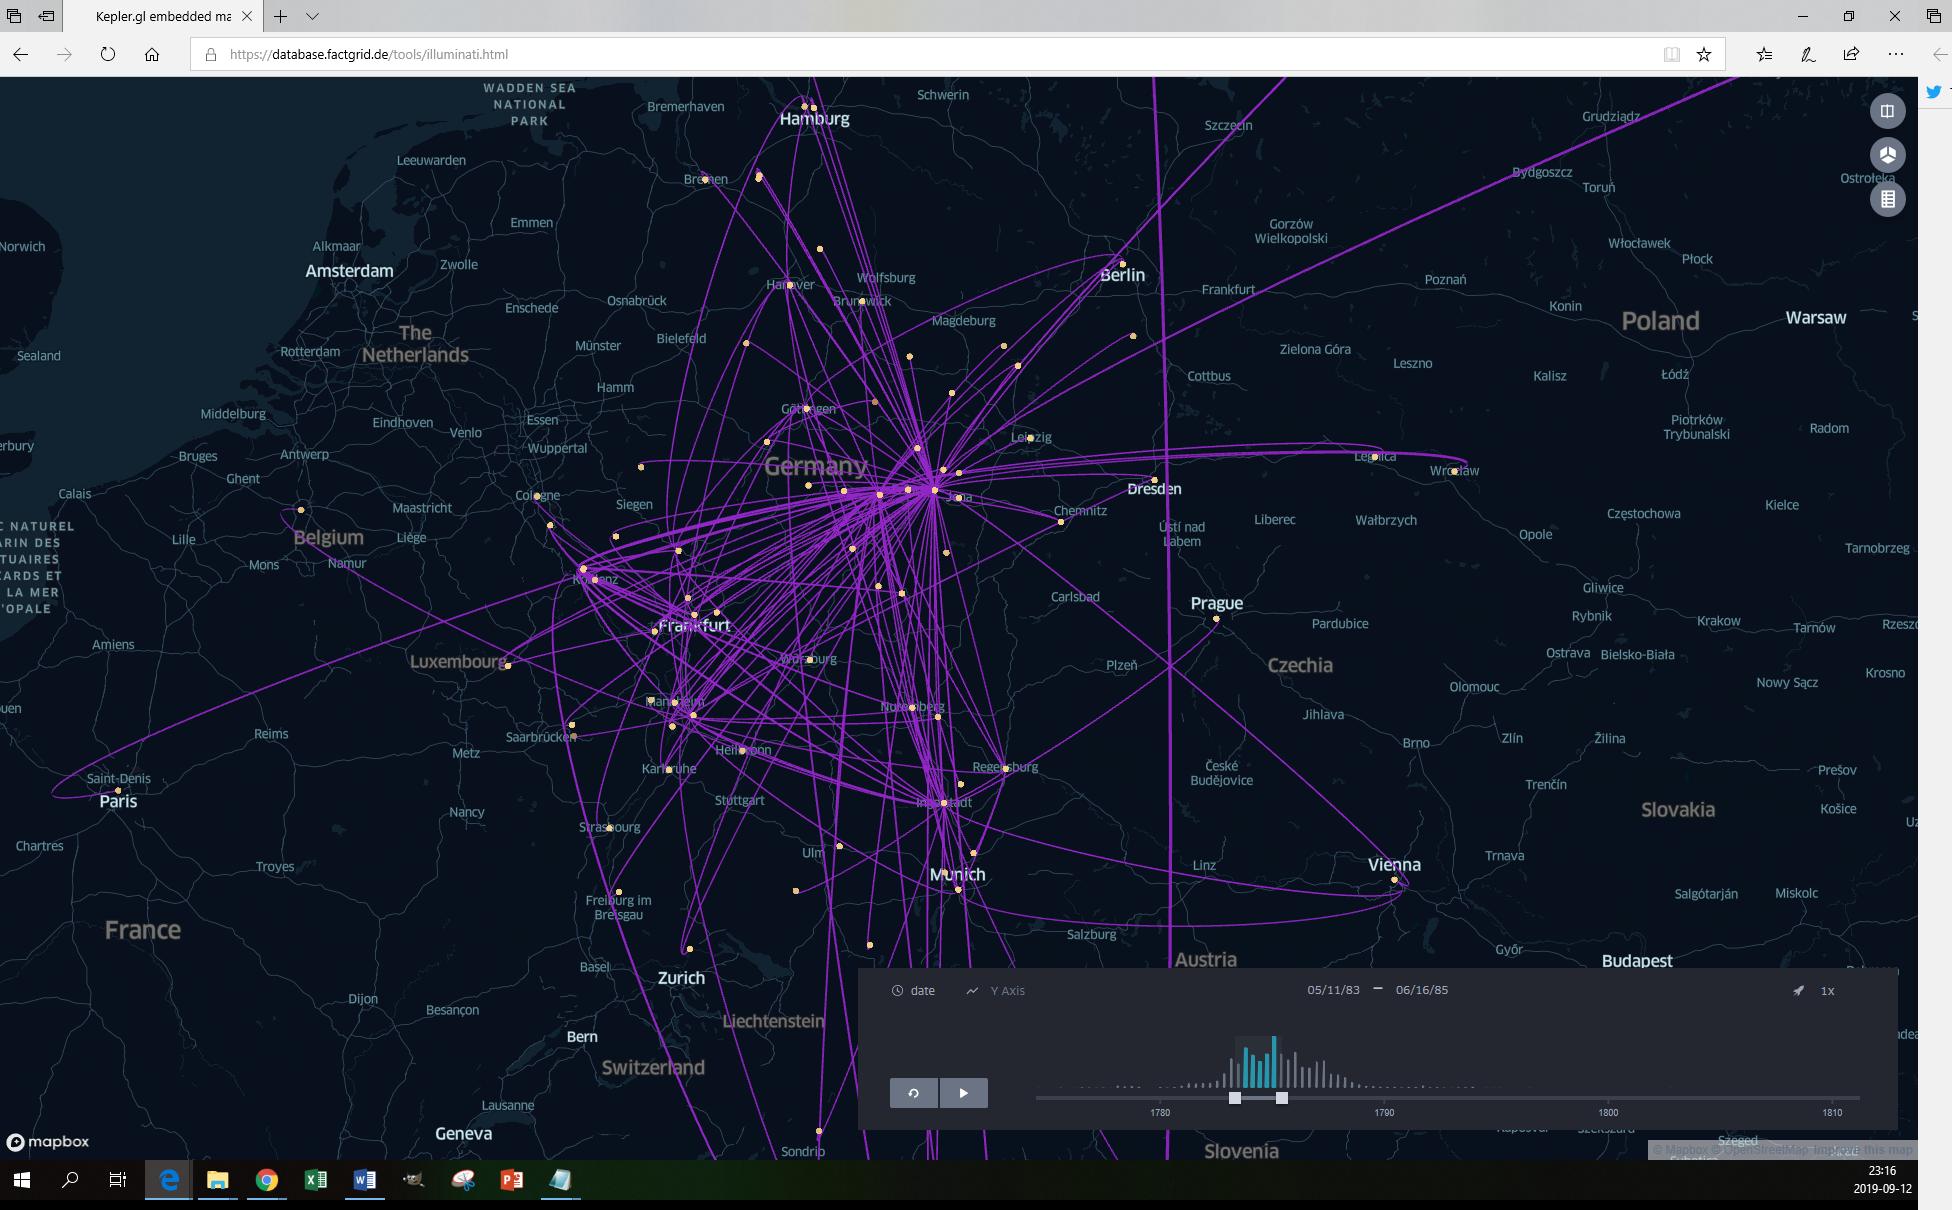
Paul-Olivier Dehaye scripted this visualisation for us – capturing the data of the Illuminati correspondence from the 1770s into the 1790s (there are some misfits in the visualisation which we can sudden spot and which need to be eliminated in the database, the visualisation is more of an aging screenshot of the database at the moment).
The idea to represent letters in lines on a map with a timeline on which the user can pick a segment that can then be shifted through the timeline – has become a classic over the last years: The Stanford Republic of Letters project seems to have been the first to come up with this visualisation ten years ago
Nodegoat is offering this kind of visualisation to anyone who opens an account with them.
The visualisation is cool for correspondences since letters happen to travel on maps from senders to recipients (or multiple recipients in case they are forwarded).
[...]
